library_name: transformers
tags:
  - semantic-segmentation
  - vision
  - ecology
datasets:
  - restor/tcd
pipeline_tag: image-segmentation
widget:
  - src: samples/610160855a90f10006fd303e_10_00418.tif
    example_title: Urban scene
license: cc
metrics:
  - accuracy
  - f1
  - iou
Model Card for Restor's SegFormer-based TCD models
This is a semantic segmentation model that can delineate tree cover in high resolution (10 cm/px) aerial images.
This model card is mostly the same for all similar models uploaded to Hugging Face. The model name refers to the specific architecture variant (e.g. nvidia-mit-b0 to nvidia-mit-b5) but the broad details for training and evaluation are identical.
This repository is for tcd-segformer-mit-b0
Model Details
Model Description
This semantic segmentation model was trained on global aerial imagery and is able to accurately delineate tree cover in similar images. The model does not detect individual trees, but provides a per-pixel classification of tree/no-tree.
- Developed by: Restor / ETH Zurich
- Funded by: This project was made possible via a (Google.org impact grant)[https://blog.google/outreach-initiatives/sustainability/restor-helps-anyone-be-part-ecological-restoration/]
- Model type: Semantic segmentation (binary class)
- License: Model training code is provided under an Apache-2 license. NVIDIA has released SegFormer under their own research license. Users should check the terms of this license before deploying. This model was trained on CC BY-NC imagery.
- Finetuned from model: SegFormer family
SegFormer is a variant of the Pyramid Vision Transformer v2 model, with many identical structural features and a semantic segmentation decode head. Functionally, the architecture is quite similar to a Feature Pyramid Network (FPN) as the output predictions are based on combining features from different stages of the network at different spatial resolutions.
Model Sources
- Repository: https://github.com/restor-foundation/tcd
- Paper: We will release a preprint shortly.
Uses
The primary use-case for this model is asessing canopy cover from aerial images (i.e. percentage of study area that is covered by tree canopy).
Direct Use
This model is suitable for inference on a single image tile. For performing predictions on large orthomosaics, a higher level framework is required to manage tiling source imagery and stitching predictions. Our repository provides a comprehensive reference implementation of such a pipeline and has been tested on extremely large images (country-scale).
The model will give you predictions for an entire image. In most cases users will want to predict cover for a specific region of the image, for example a study plot or some other geographic boundary. If you predict tree cover in an image you should perform some kind of region-of-interest analysis on the results. Our linked pipeline repository supports shapefile-based region analysis.
Out-of-Scope Use
While we trained the model on globally diverse imagery, some ecological biomes are under-represented in the training dataset and performance may vary. We therefore encourage users to experiment with their own imagery before using the model for any sort of mission-critical use.
The model was trained on imagery at a resolution of 10 cm/px. You may be able to get good predictions at other geospatial resolutions, but the results may not be reliable. In particular the model is essentially looking for "things that look like trees" and this is highly resolution dependent. If you want to routinely predict images at a higher or lower resolution, you should fine-tune this model on your own or a resampled version of the training dataset.
The model does not predict biomass, canopy height or other derived information. It only predicts the likelihood that some pixel is covered by tree canopy.
As-is, the model is not suitable for carbon credit estimation.
Bias, Risks, and Limitations
The main limitation of this model is false positives over objects that look like, or could be confused as, trees. For example large bushes, shrubs or ground cover that looks like tree canopy.
The dataset used to train this model was annotated by non-experts. We believe that this is a reasonable trade-off given the size of the dataset and the results on independent test data, as well as empirical evaluation during operational use at Restor on partner data. However, there are almost certainly incorrect labels in the dataset and this may translate into incorrect predictions or other biases in model output. We have observed that the models tend to "disagree" with training data in a way that is probably correct (i.e. the aggregate statistics of the labels are good) and we are working to re-evaluate all training data to remove spurious labels.
We provide cross-validation results to give a robust estimate of prediction performance, as well as results on independent imagery (i.e. images the model has never seen) so users can make their own assessments. We do not provide any guarantees on accuracy and users should perform their own independent testing for any kind of "mission critical" or production use.
There is no substitute for trying the model on your own data and performing your own evaluation; we strongly encourage experimentation!
How to Get Started with the Model
You can see a brief example of inference in this Colab notebook.
For end-to-end usage, we direct users to our prediction and training pipeline which also supports tiled prediction over arbitrarily large images, reporting outputs, etc.
Training Details
Training Data
The training dataset may be found here, where you can find more details about the collection and annotation procedure. Our image labels are largely released under a CC-BY 4.0 license, with smaller subsets of CC BY-NC and CC BY-SA imagery.
Training Procedure
We used a 5-fold cross-validation process to adjust hyperparameters during training, before training on the "full" training set and evaluating on a holdout set of images. The model in the main branch of this repository should be considered the release version.
We used Pytorch Lightning as our training framework with hyperparameters listed below. The training procedure is straightforward and should be familiar to anyone with experience training deep neural networks.
A typical training command using our pipeline for this model:
tcd-train semantic segformer-mit-b0 data.output= ... data.root=/mnt/data/tcd/dataset/holdout data.tile_size=1024
Preprocessing
This repository contains a pre-processor configuration that can be used with the model, assuming you use the transformers library.
You can load this preprocessor easily by using e.g.
from transformers import AutoImageProcessor
processor = AutoImageProcessor.from_pretrained('restor/tcd-segformer-mit-b0')
Note that we do not resize input images (so that the geospatial scale of the source image is respected) and we assume that normalisation is performed in this processing step and not as a dataset transform.
Training Hyperparameters
- Image size: 1024 px square
- Learning rate: initially 1e4-1e5
- Learning rate schedule: reduce on plateau
- Optimizer: AdamW
- Augmentation: random crop to 1024x1024, arbitrary rotation, flips, colour adjustments
- Number of epochs: 75 during cross-validation to ensure convergence; 50 for final models
- Normalisation: Imagenet statistics
Speeds, Sizes, Times
You should be able to evaluate the model on a CPU (even up to mit-b5) however you will need a lot of available RAM if you try to infer large tile sizes. In general we find that 1024 px inputs are as large as you want to go, given the fixed size of the output segmentation masks (i.e. it is probably better to perform inference in batched mode at 1024x1024 px than try to predict a single 2048x2048 px image).
All models were trained on a single GPU with 24 GB VRAM (NVIDIA RTX3090) attached to a 32-core machine with 64GB RAM. All but the largest models can be trained in under a day on a machine of this specification. The smallest models take under half a day, while the largest models take just over a day to train.
Feedback we've received from users (in the field) is that landowners are often interested in seeing the results of aerial surveys, but data bandwidth is often a prohibiting factor in remote areas. One of our goals was to support this kind of in-field usage, so that users who fly a survey can process results offline and in a reasonable amount of time (i.e. on the order of an hour).
Evaluation
We report evaluation results on the OAM-TCD holdout split.
Testing Data
The training dataset may be found here.
This model (main branch) was trained on all train images and tested on the test (holdout) images.
Metrics
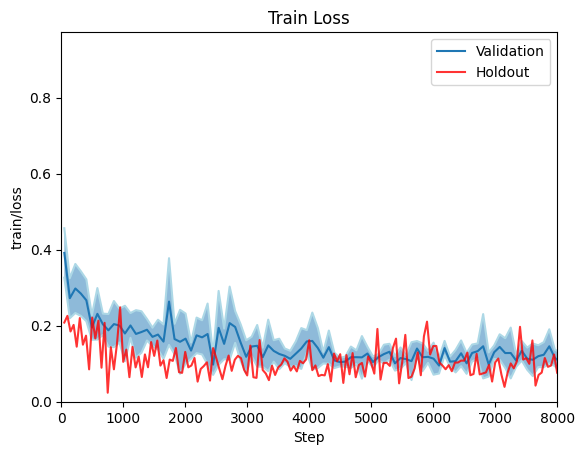
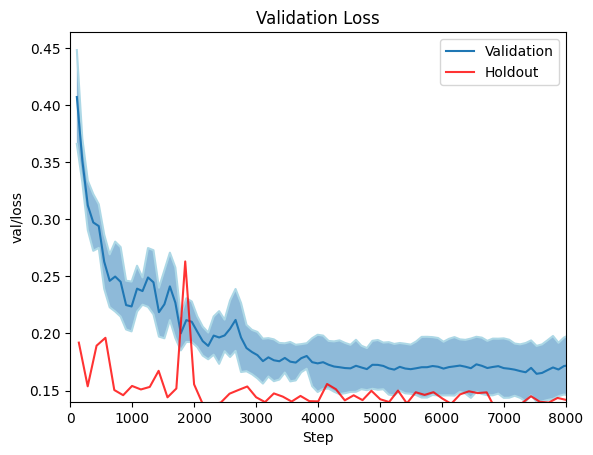
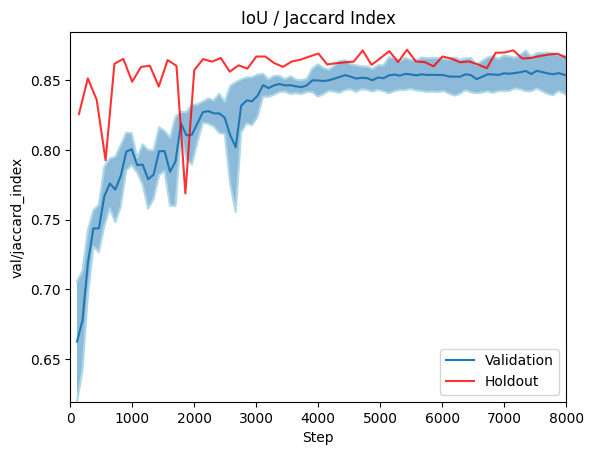
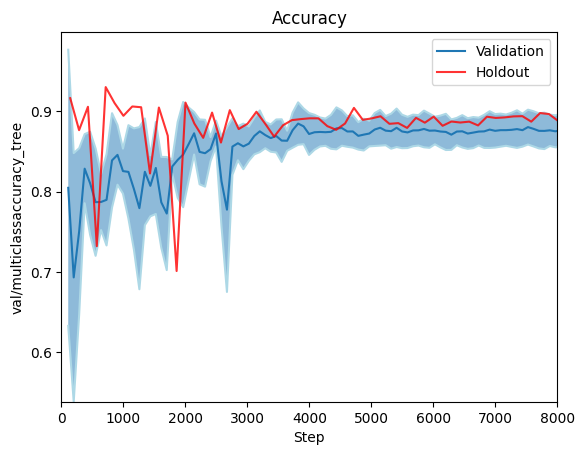
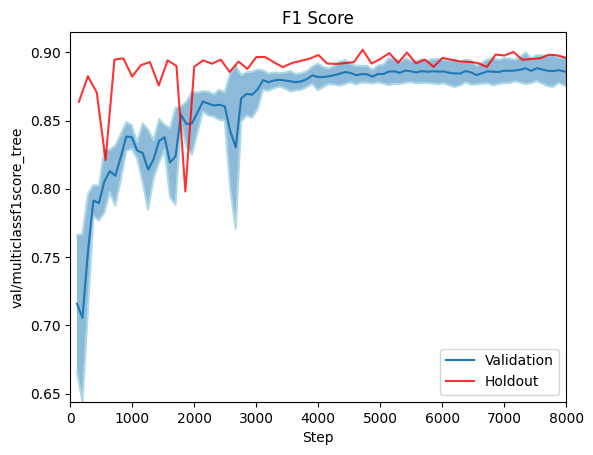
We report F1, Accuracy and IoU on the holdout dataset, as well as results on a 5-fold cross validation split. Cross validtion is visualised as min/max error bars on the plots below.
Results
Environmental Impact
This estimate is the maximum (in terms of training time) for the SegFormer family of models presented here. Smaller models, such as mit-b0 train in less than half a day.
- Hardware Type: NVIDIA RTX3090
- Hours used: < 36
- Carbon Emitted: 5.44 kg CO2 equivalent per model
Carbon emissions were be estimated using the Machine Learning Impact calculator presented in Lacoste et al. (2019).
This estimate does not take into account time require for experimentation, failed training runs, etc. For example since we used cross-validation, each model actually required approximately 6x this estimate - one run for each fold, plus the final run.
Efficient inference on CPU is possible for field work, at the expense of inference latency. A typical single-battery drone flight can be processed in minutes.
Citation
We will provide a preprint version of our paper shortly. In the mean time, please cite as:
BibTeX:
@unpublished{restortcd,
  author = "Veitch-Michaelis, Josh and Cottam, Andrew and Schweizer, Daniella Schweizer and Broadbent, Eben N. and Dao, David and Zhang, Ce and Almeyda Zambrano, Angelica and Max, Simeon",
  title  = "OAM-TCD: A globally diverse dataset of high-resolution tree cover maps",
  note   = "In prep.",
  month  = "06",
  year   = "2024"
}
Model Card Authors
Josh Veitch-Michaelis, 2024; on behalf of the dataset authors.
Model Card Contact
Please contact josh [at] restor.eco for questions or further information.
